Plot 3D projections
Render injection sites and target regions as 3D isosurfaces overlaid on atlas anatomy.
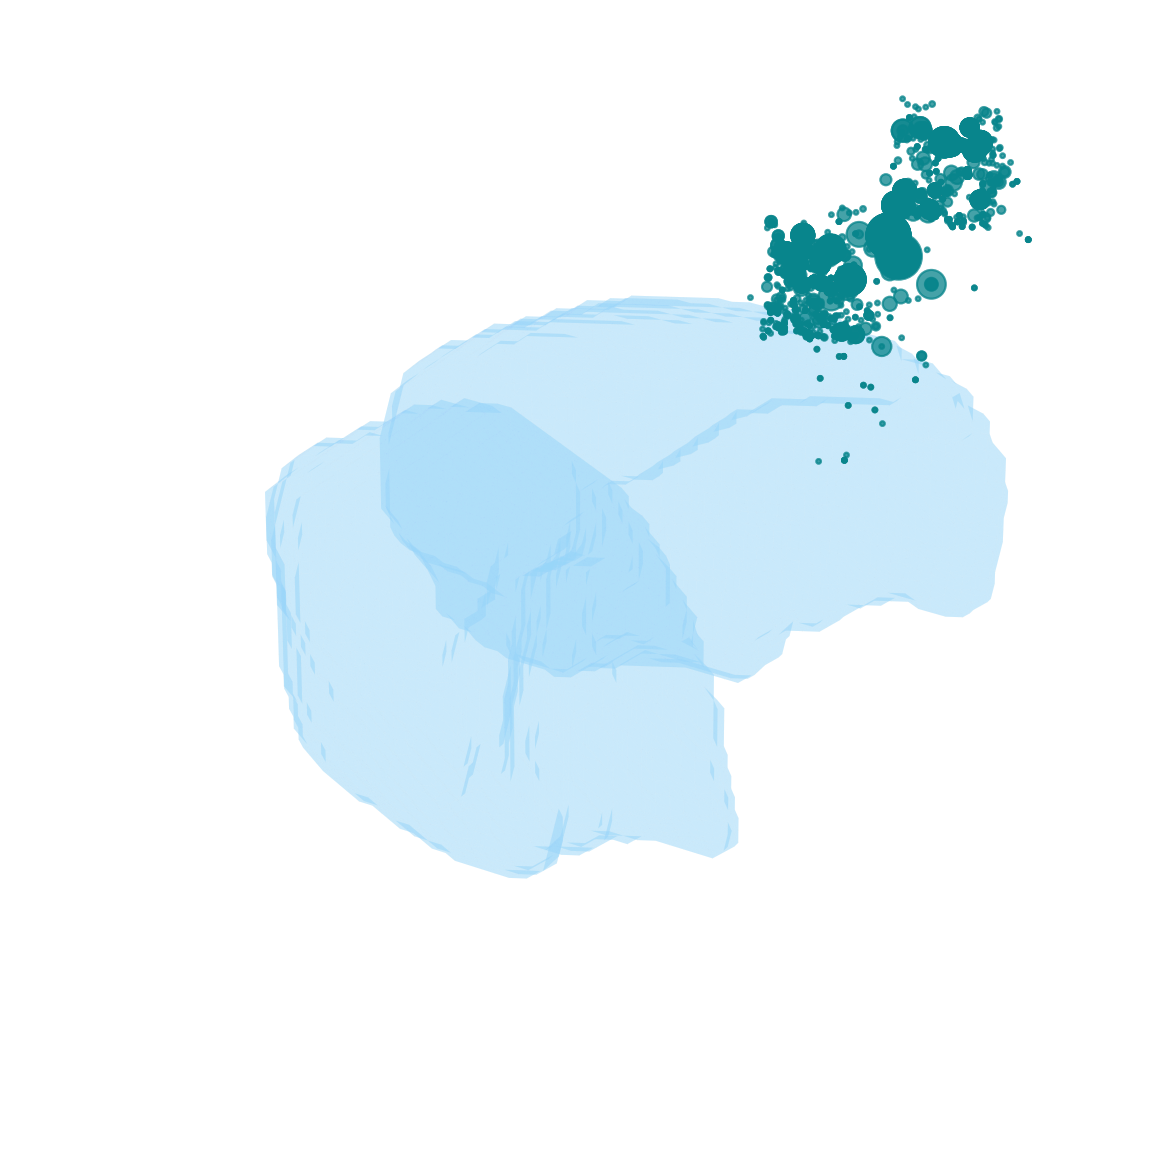
3D rendering of VISam injection sites (dots) and caudate putamen (transparent volume).
Python:
bsv.plot_connectivity_3d(
    injection_summary, '/path/to/allenCCF', 'CP',
    color=[[0.543, 0, 0], [0, 0.746, 1]],
    plot_patch=True,   # True = solid volume, False = grid points
    animate=True)      # rotating animation (Python only)
MATLAB:
bsv.plotConnectivity3D(injectionSummary, allenAtlasPath, 'CP', color, true);