Striatum subregion analysis
Break down projection density by anatomical subdivisions of the caudate putamen (CP) and nucleus accumbens (NAc) using the Allen v2 atlas, with optional CSV export.
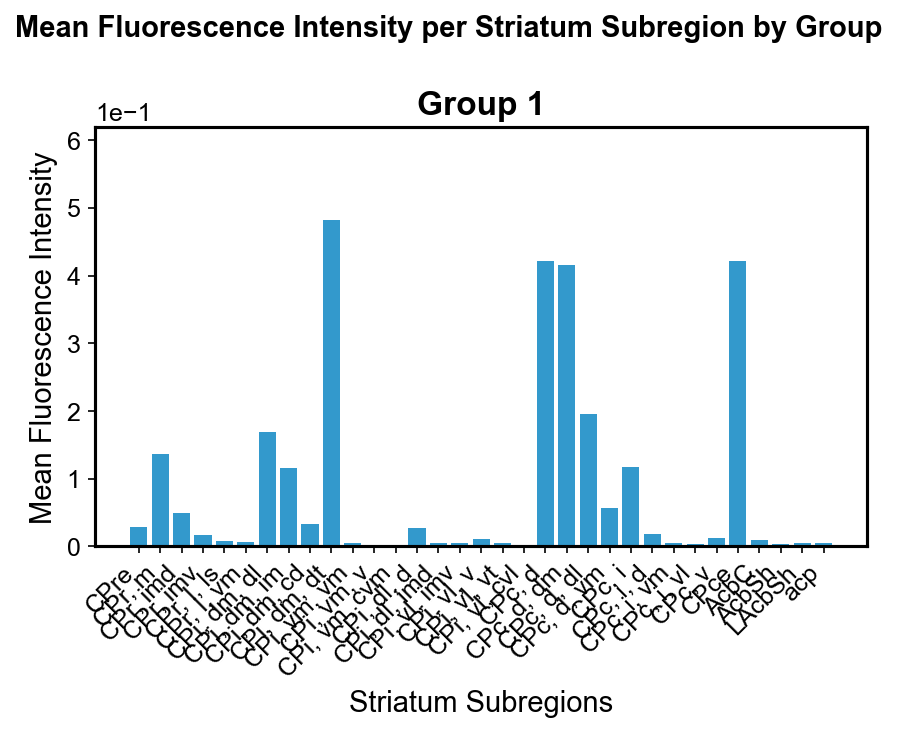
Mean fluorescence intensity per striatum subregion for projections from all visual cortical areas to CP and NAc. Subregions are defined by the Allen v2 atlas.
Requires the Allen v2 atlas files (annotation_volume_v2_20um_by_index.npy and UnifiedAtlas_Label_ontology_v2.csv) in a separate directory.
Python:
# First get the projection matrix from plot_connectivity
proj_matrix, proj_coords = bsv.plot_connectivity(
    experiment_imgs, '/path/to/allenCCF', 'CP',
    10, 15, 'coronal', True, 2, 'global', None, 'injectionIntensity')

# Analyze subregions
subregion_results, global_results = bsv.analyze_cp_subregions(
    proj_matrix, proj_coords, '/path/to/allenCCF_v2')

# Export to CSV
subregion_results, global_results = bsv.analyze_cp_subregions(
    proj_matrix, proj_coords, '/path/to/allenCCF_v2',
    save_csv_path='/path/to/output.csv')

# Or do plot + analysis in one step
proj_matrix, proj_coords, sub_results, glob_results = \
    bsv.plot_connectivity_with_subregion_analysis(
        experiment_imgs, '/path/to/allenCCF', '/path/to/allenCCF_v2',
        'CP', 10, 15, 'coronal', True, 2, 'global', None, 'injectionIntensity')
MATLAB:
[projMatrix, projCoords] = bsv.plotConnectivity(experimentImgs, allenAtlasPath, ...
    'CP', 10, 15, 'coronal', true, 2, 'global', [], 'injectionIntensity');

[subResults, globalResults] = bsv.analyzeCPSubregions(projMatrix, projCoords, ...
    allenAtlasPath_v2, [], inputRegions, [], csvPath);