Plot 3D projections
Render injection sites and target regions as 3D isosurfaces overlaid on atlas anatomy.
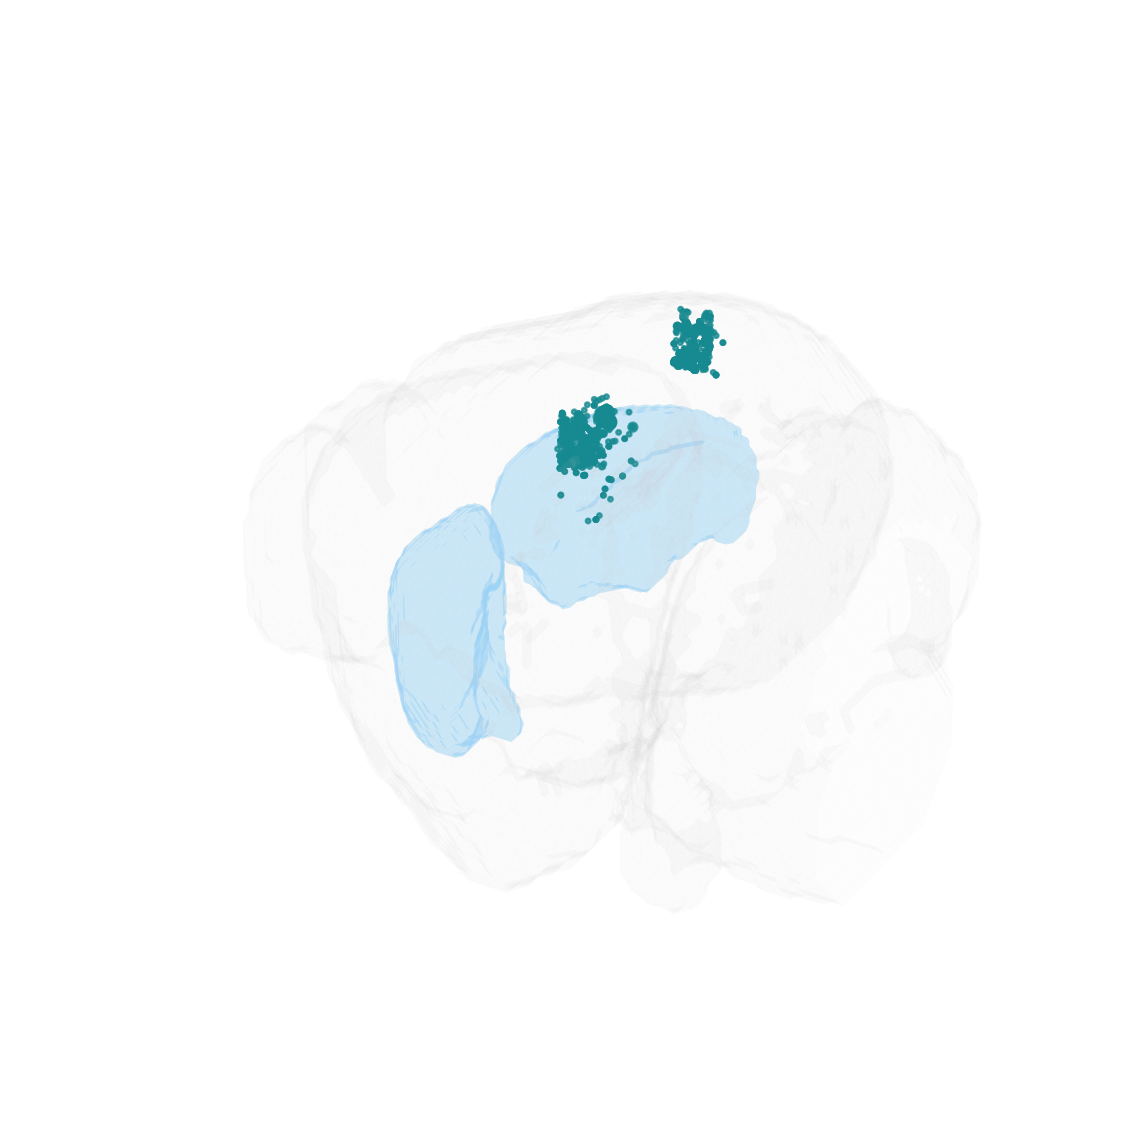
3D rendering of VISam injection sites (dots) and caudate putamen (transparent volume).
Python:
bsv.plot_connectivity_3d(
    injection_summary=injection_summary,   # dict of lists: injection metadata from fetch_connectivity_data
    allen_atlas_path='/path/to/allenCCF', # atlas files auto-downloaded here on first use
    region_to_plot='CP',                  # target region acronym
    color=[[0.543, 0, 0], [0, 0.746, 1]], # RGB colour(s) for injection dots, one per group
    plot_patch=True,                      # render region as solid isosurface (False for grid)
    animate=True)                         # rotating animation (False for static figure)
MATLAB:
bsv.plotConnectivity3D( ...
    injectionSummary, ... % struct: injection metadata from fetchConnectivityData
    allenAtlasPath, ...   % atlas files auto-downloaded here on first use
    'CP', ...             % target region acronym
    color, ...            % RGB colour(s) for injection dots, one per group
    true);                % plot_patch: solid isosurface (false for grid)